
Buy Sell Supertrend M1 to H4 || Buy sell signal TradingView indicator
Original price was: $3,999.00.$199.00Current price is: $199.00.
- Clear visual signals
- Works on multiple timeframes
- Suitable for Tradingview market
- Helps identify reversal points
- Simple trading rules
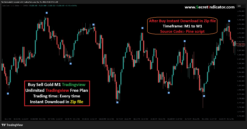
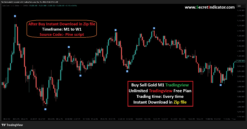
- Unlimited Tradingview Free Plan
- Trading time: Every time
- Instant Download in Zip file
- Timeframe: M1 to W1
- Source Code:- Pine script
- Lifetime Version
Part 1: How to Trade the “Buy Sell Supertrend M1 to H4 || Buy sell signal TradingView indicator” Signals
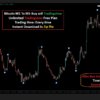
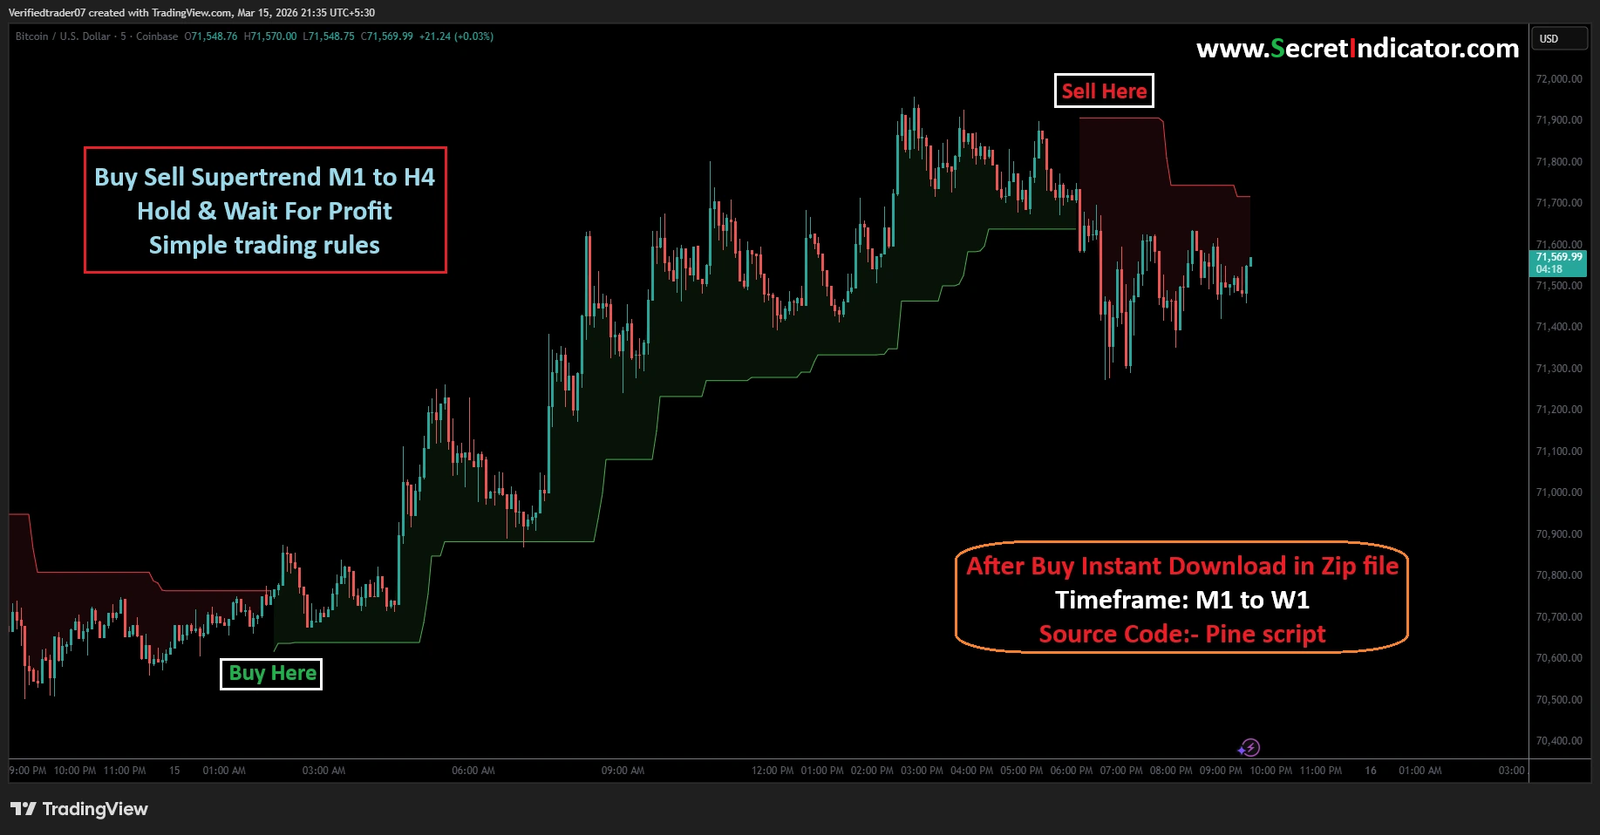
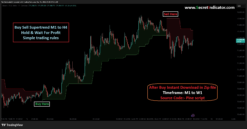
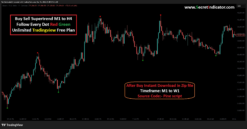
The image displays a classic “trend-following” indicator. It attempts to capture large price movements.
1. Understanding the Signals
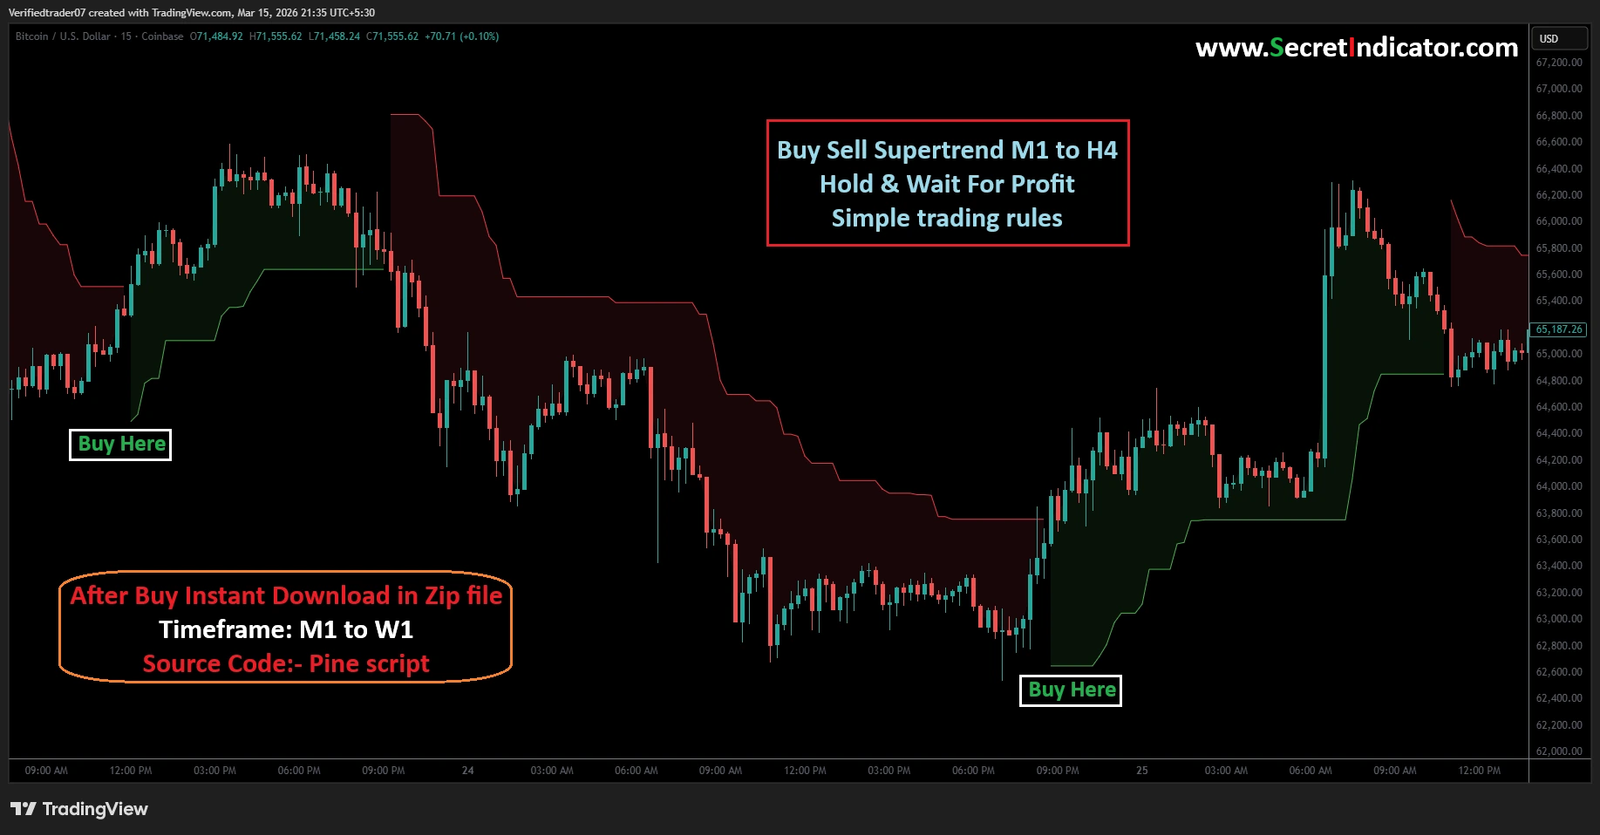
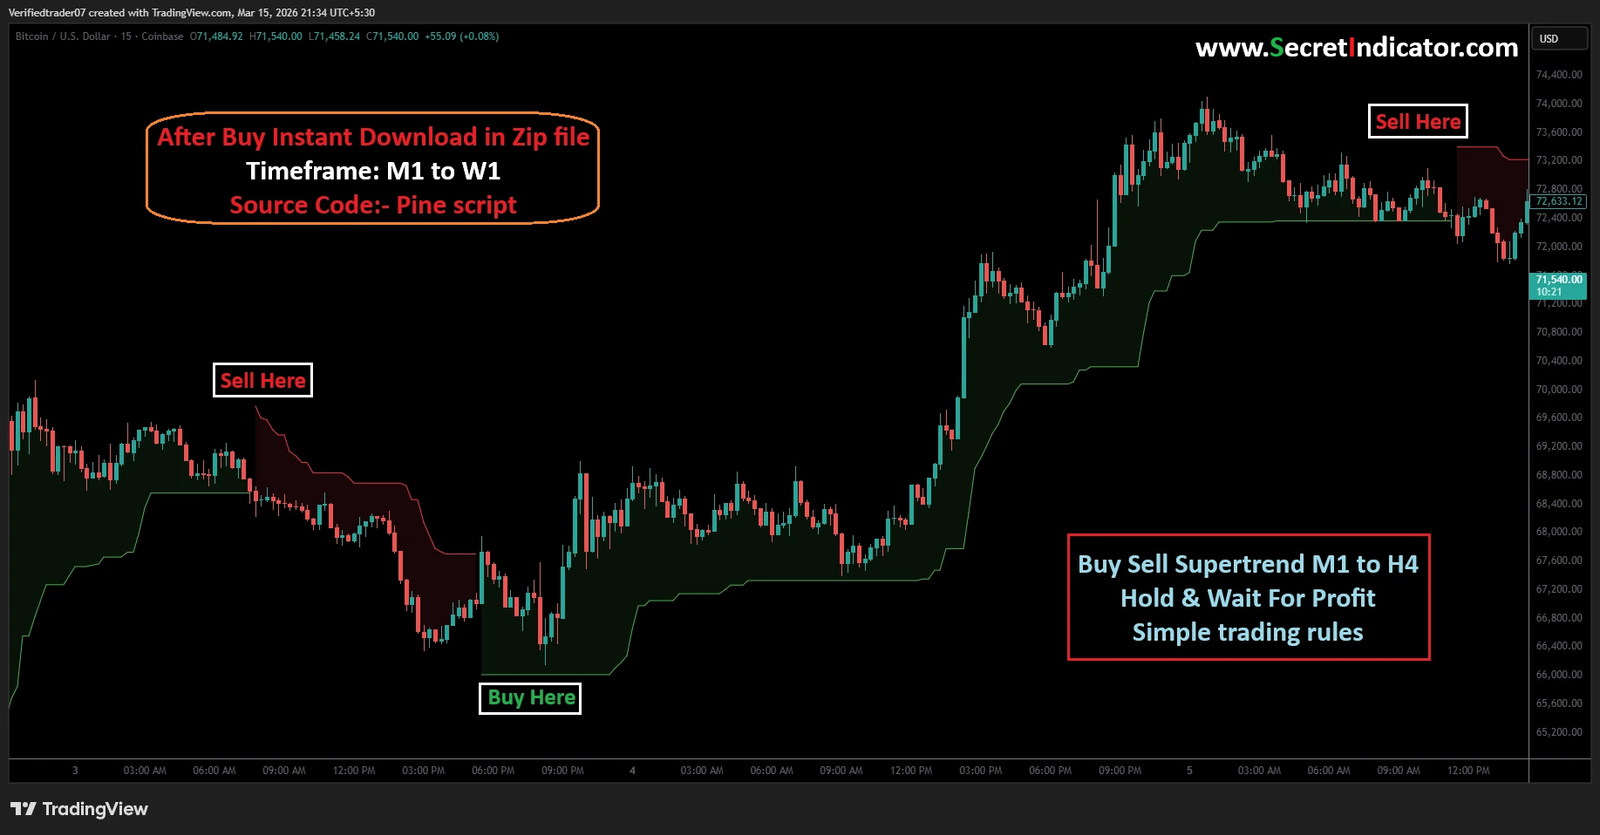
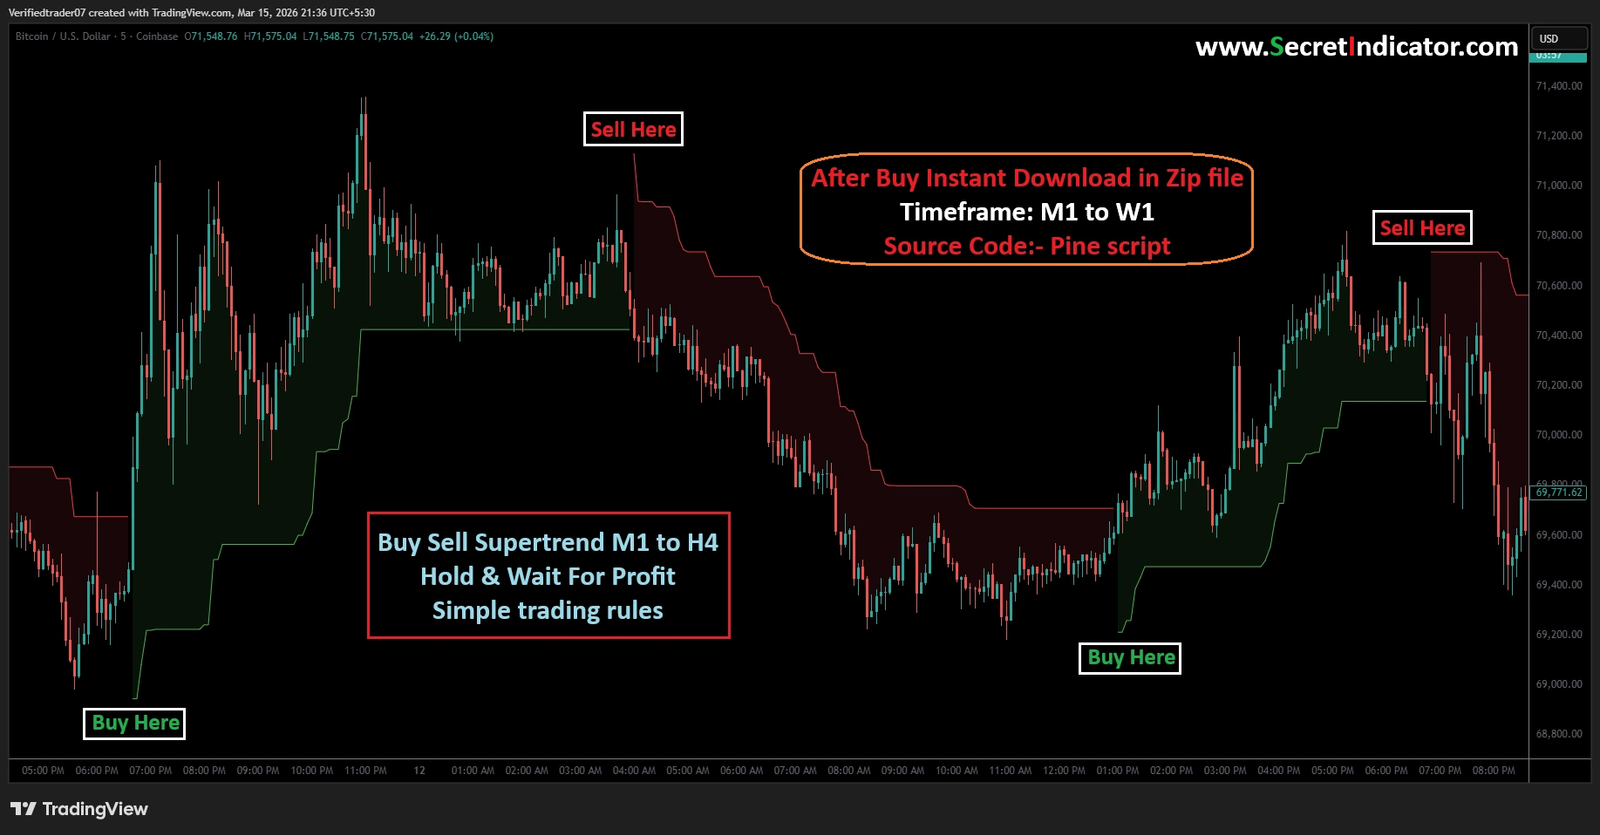
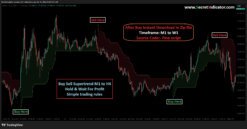
- Green Background/Line (“Buy Here”): The indicator believes the market is in an uptrend. The background turns green, and the Supertrend line acts as visual support below the price.
- Red Background/Line (“Sell Here”): The indicator believes the market is in a downtrend. The background turns red, and the Supertrend line acts as visual resistance above the price.
2. Placing Stop Loss (SL)
This is your most crucial decision. The Supertrend indicator itself provides a “dynamic” stop-loss level.
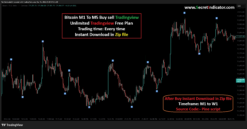
- For a Buy Trade (Long): Place your initial Stop Loss just below the green line. In the image, when the “Buy Here” signal appears around $66,400, your SL would be placed slightly below the green level (roughly $66,000). As the price rises and the green line moves up (as seen later on the chart), you can “trail” your SL by moving it up to the new green line level. This locks in profits.
- For a Sell Trade (Short): Place your initial Stop Loss just above the red line. When the “Sell Here” signal appears around $73,200, your SL would be placed slightly above the red level. As the price moves down and the red line moves down, you “trail” your SL by moving it to the new red line level.
3. Taking Profit (TP)
Trend-following indicators are great for big moves, but they are laggy. They will always signal an exit after the top or bottom has passed.
- The “Indicator Only” Method: The simplest (though not necessarily most profitable) exit is to simply wait for the indicator to flip to the opposite signal. You hold the Buy position until a new Sell signal appears, and vice versa. The text in the red box suggests this: “Hold & Wait for Profit.”
- The Proactive Method (Targeting): To maximize gains before a reversal, you can use fixed targets based on your risk. A common and healthy target is a 1:2 Risk-to-Reward Ratio. If you are risking $200 (distance between entry and Stop Loss), you aim for $400 in profit. When the price hits your $400 target, you close the trade and don’t wait for the indicator to flip.
Part 2: Essential Risk Management
Using an indicator will not save you if you don’t have good money management.
- The 1% Rule: Determine the exact dollar amount you are comfortable losing if your Stop Loss is hit. This amount should never exceed 1% (or max 2%) of your total trading capital. If you have a $10,000 account, you should not risk more than $100 per trade.
- Position Sizing: If your entry is $70,000 and your SL is $69,000, you have a $1,000 risk per Bitcoin. If your maximum dollar risk is $100 (1% of a $10k account), you must only buy 0.1 BTC ($100 / $1,000 risk distance). This calculation ensures you don’t ruin your account on one bad trade.
- No Exceptions: Never, ever trade without a predefined Stop Loss. The market can wipe out an account in minutes without one.
Part 3: Installation & Usage (How to “Install” a Script Like This)
The text on the image specifies this is a Pine Script for TradingView. You cannot use this directly on standard MetaTrader 4/5 platforms (unless you buy a separate version converted for MT4/5). If you have purchased the source code/access:
- Open TradingView: Navigate to the chart you want to trade (e.g., BTCUSD).
- Open Pine Editor: At the bottom of the TradingView interface, locate and click on the “Pine Editor” tab.
- Paste the Code: If you were given a file with code, open it, copy everything, and paste it into the Pine Editor. (Alternatively, you might be given access to an “Invite-only” script, which will appear directly in your Indicators list).
- Add to Chart: Click the blue “Add to chart” button in the Pine Editor. The indicator will appear, looking like the one in your image.
- Setting the Timeframe (TF): The image mentions timeframes from M1 (1 minute) up to H4 (4 hours).
- Crucial Rule: Always align your chart’s timeframe to the timeframe you want to trade. If the indicator is optimized for the H1 chart, use it on the H1 chart. Do not use an H1 signal on a 1-minute chart. The most reliable signals typically come from higher timeframes like H1 or H4.
Part 4: Extra Tips for Beginners
- Indicators are Tools, Not Oracles: indicator is 100% accurate. This indicator will perform beautifully in a strong, trending market (like the one shown). It will lose money repeatedly in a “choppy” or sideways market. When you see the green and red lines flipping back and forth quickly and the price is moving flat, stop using the indicator and stay out of the market.
- Look for Confluence: Don’t rely only on the Buy/Sell text. Before entering, ask yourself: is the price also near a major support level? Is there important economic news scheduled soon (which could cause erratic movements and make indicators fail)? Trading with multiple reasons is always stronger.
- Master Your Emotions: The hardest part of trading is sticking to the rules. If you are in a buy trade and the price starts falling toward your Stop Loss, do not move the SL further away hoping for a recovery. Accepting the small, planned loss is part of being a successful trader.
Our Payment Options:
1) Bitcoin Wallet:
2) USDT(Tether) Wallet: (Request)
3) TRX(Tron) Wallet: (Request)
4) XRP(Ripple): Tag(Request)
And another crypto wallet: on request
5) Visa/Master Card Via Payment Link: On Request
6) Paypal: Not Accept
7) Skrill: On Request
8) Neteller: On Request
9) Western Union: On Request
10) This Website(www.secretindicator.com). You can purchase directly from the website with Your Credit/Debit Cards and All cryptocurrencies and Instant Download Indicator Files.
Send payment screenshot to: 
Payment After we will provide the product within 90 minutes.
If you want any proof of Indicator or have any questions then feel free to message
Telegram: Click Here
Mail Us: Click Here
Whatsapp: Click Here
Be the first to review “Buy Sell Supertrend M1 to H4 || Buy sell signal TradingView indicator”
Related products
Reviews
There are no reviews yet.